File:TSS and DEGs - Figure2a.png
From Muscle
Size of this preview: 613 × 599 pixels. Other resolutions: 246 × 240 pixels | 1,327 × 1,297 pixels.
Original file (1,327 × 1,297 pixels, file size: 414 KB, MIME type: image/png)
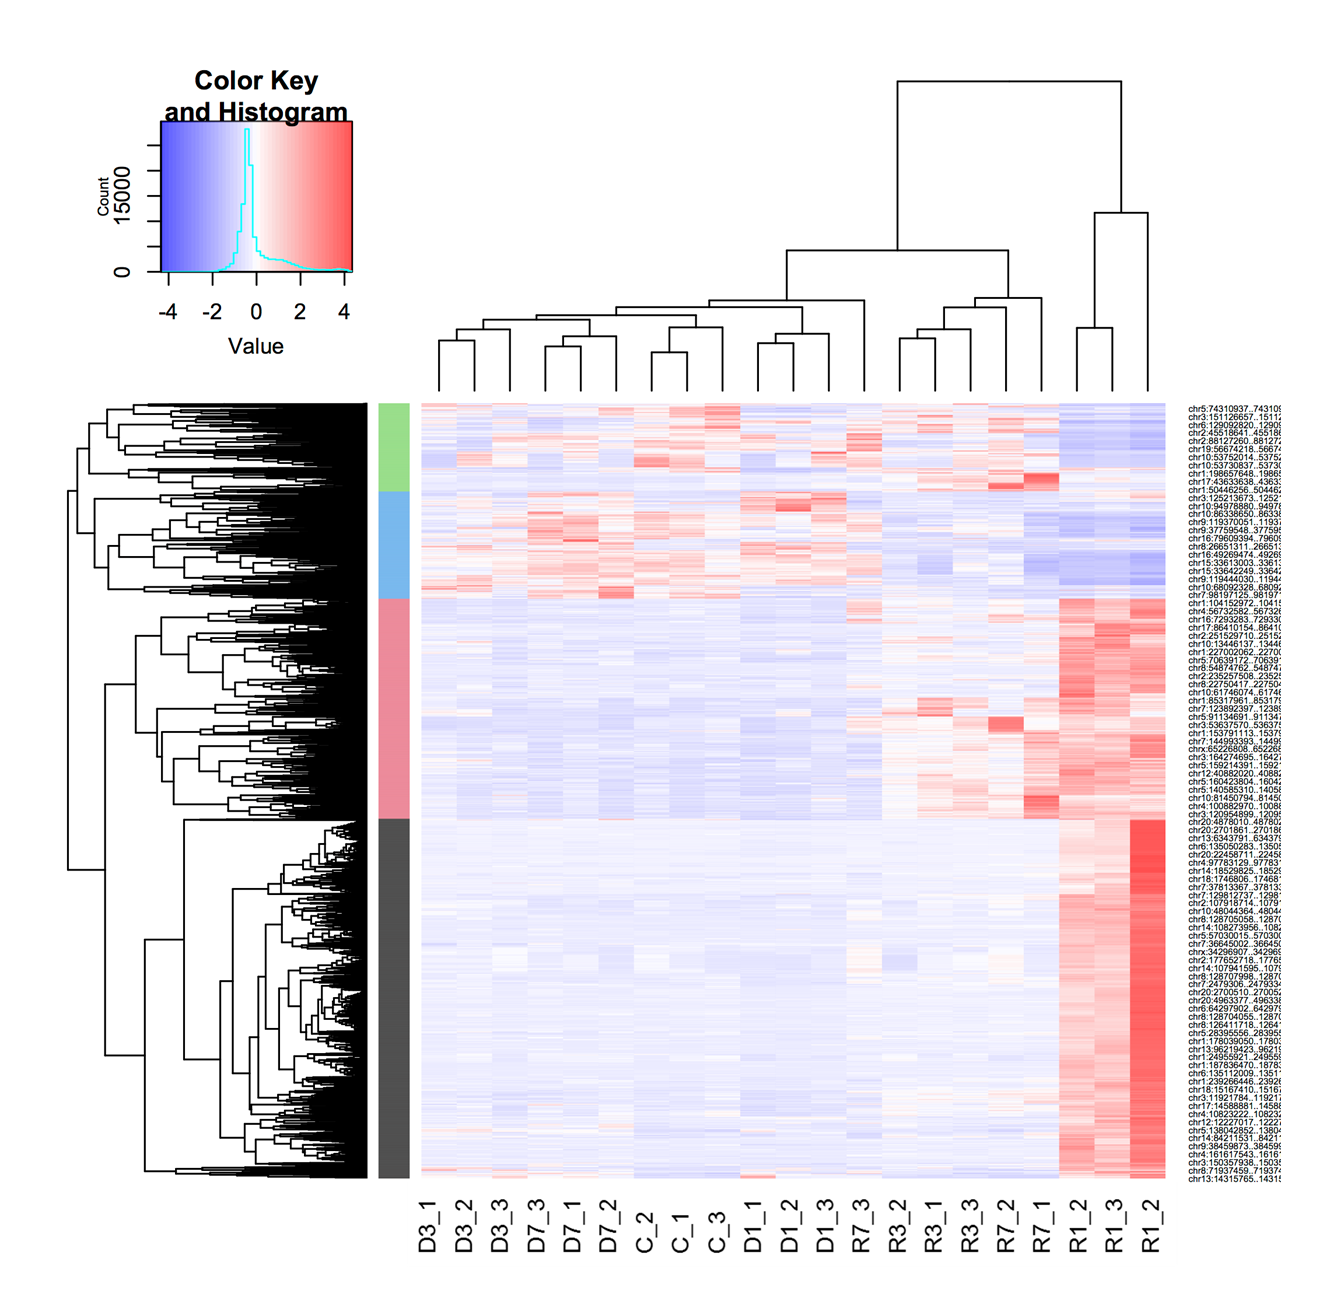
Clusterization of differentially expressed peaks (both genic and intergenic) common to both phase-control and time-course comparisons. FDR threshold 5e-04. Clusters of the metabolism regulation through MAP kinase activity, actin biosynthesis, nucleosome assembly, and lipid metabolism are shown in black, green, blue, and red, respectively
File history
Click on a date/time to view the file as it appeared at that time.
| Date/Time | Thumbnail | Dimensions | User | Comment | |
|---|---|---|---|---|---|
| current | 12:28, 2 March 2021 | | 1,327 × 1,297 (414 KB) | Sspintus@dote.ru (talk | contribs) | Clusterization of differentially expressed peaks (both genic and intergenic) common to both phase-control and time-course comparisons. FDR threshold 5e-04. Clusters of the metabolism regulation through MAP kinase activity, actin biosynthesis, nucleosom... |
- You cannot overwrite this file.
File usage
The following 3 pages link to this file: